boot failure: systemctl status system-fsck-root.service

boot failure: systemctl status system-fsck-root.service

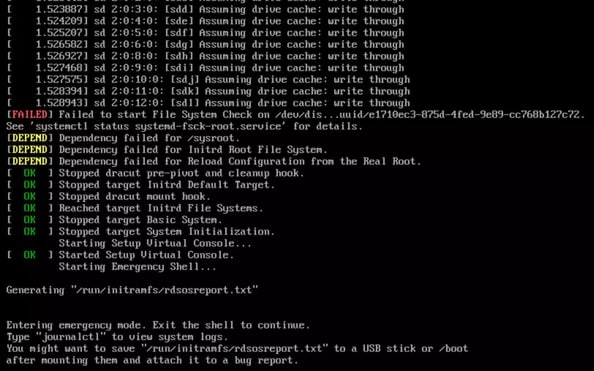
I had downtime in my lab due to an power failure which resulted in a boot failure of my VCSA 6.5 appliance. Looking on the console showed me a “[FAILED] Failed to start File System Check on /dev/dis…uuid/uuid. See ‘systemctl status system-fsck-root.service’ for details.” message. Therefor it booted into ‘Emergency Shell’ or ‘Emergency mode’.

File system check error

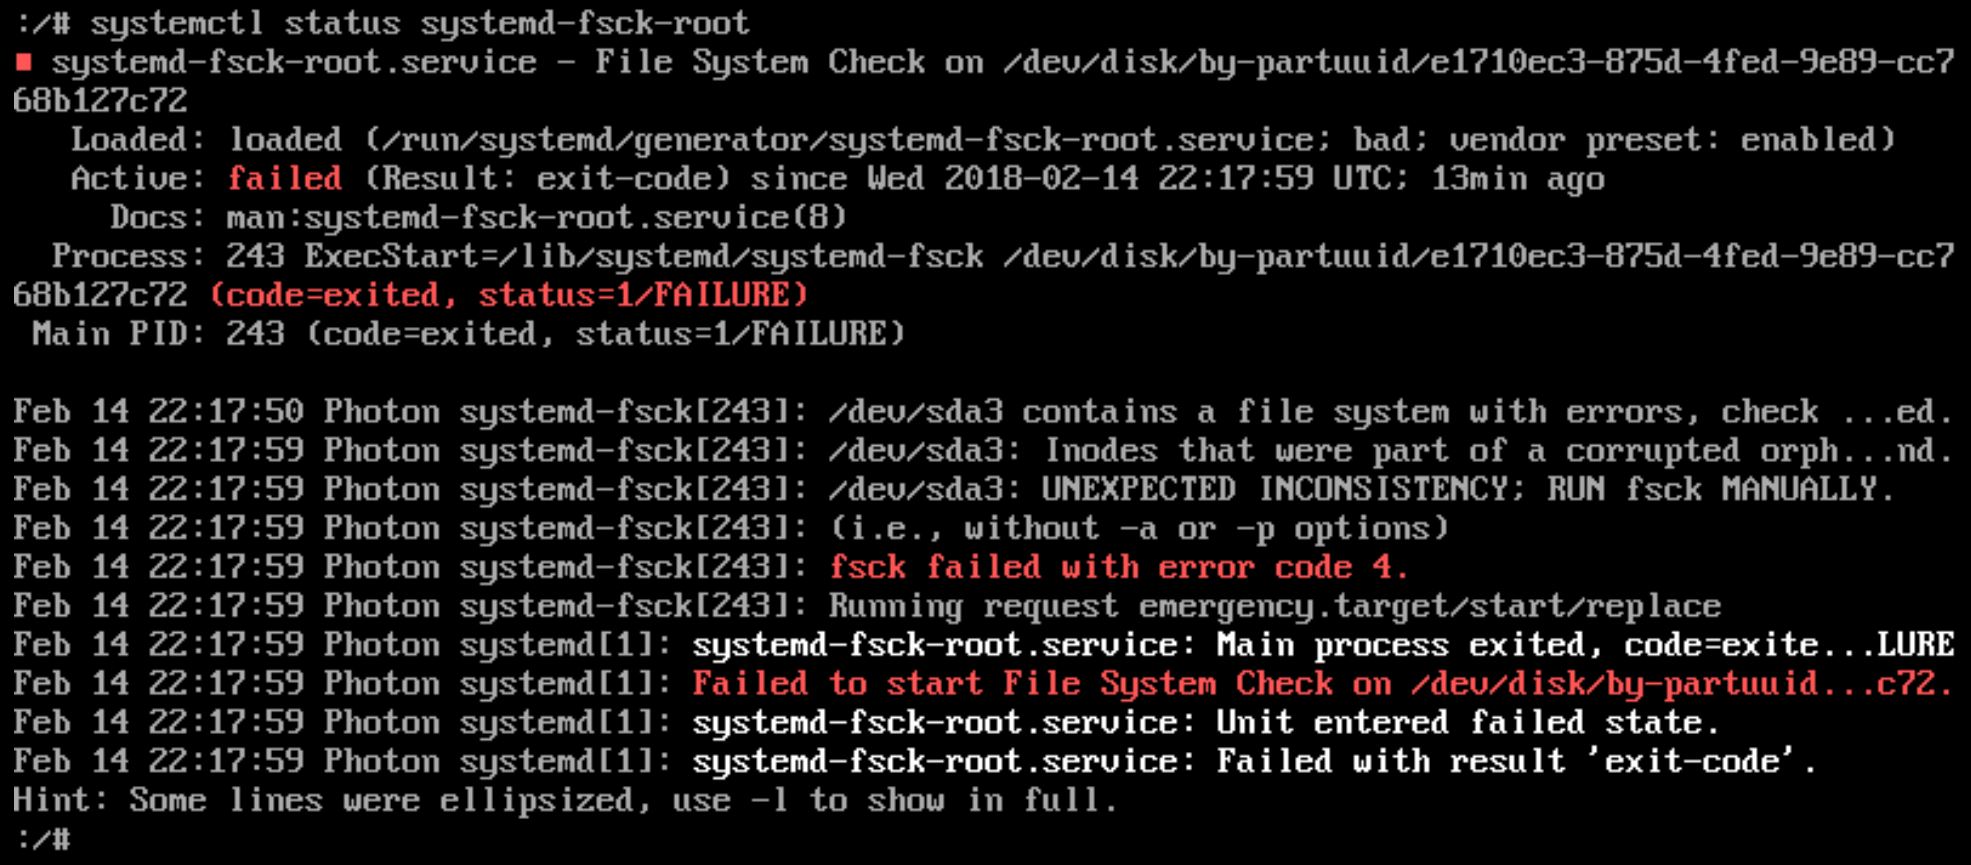
I ran the command ‘systemctl status systemd-fsck-root’ manually. This showed me that the ‘/dev/sda3’ partition was having issues.

UPDATE: It also states “RUN fsck MANUALLY”. I did not notice this the first time

File System Check service failure

I tried to run fsck with no options to see if the command was known to the CLI. Then I ran the command with the partition as a parameter ‘fsck /dev/sda3’.

I answered ‘y(es)’ to all ‘Fix<y>?’ questions.

Running File System Check

In the end I received the message ‘FILE SYSTEM WAS MODIFIED’ and tried to reboot. The reboot command gave me an error so I went through the ESXi to reset the virtual machine. Afterwards I was able to login again.

File System Modified
Manage your PowerCLI vCenter menu entries

Manage your PowerCLI vCenter menu entries

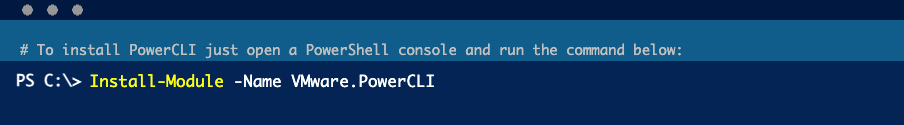
When connecting to your vCenter server via PowerCLI, one can use the -menu option. This will give a list of entries you recently used. You can manage the entries here:

C:UsersusernameAppdataRoamingVMwarePowerCLIRecentServerList.xml

View the registered entries

Connect-viserver -menu
vShield Endpoint SVM status vCenter alarm

vShield Endpoint SVM status vCenter alarm

vCenter is showing an alarm on the TrendMicro Deep Security Virtual Appliance (DSVA): ‘vShield Endpoint SVM status’

vCenter vShield Alarm

Checking vShield for errors:

vShield errors

The DSVA VA console window shows: (as to where it should show a red/grey screen)

DSVA VA console

Let’s go for some log file analysis

To get a login prompt: Alt + F2

Login with user dsva and password dsva (this is the default)

The log file we are going to check is the messages log file at /var/log/messages

less /var/log/messages

(why less is more: you get almost all the vi commands)

To go to the last line:

G

DSVA messages log file

For some reason the ovf file is not like it is expected. The appliance is not able to set some ovf settings, in this case the network interfaces.

To exit the log file display mode:

q

To gain root privileges:

sudo -s

Enter the dsva user password

Navigate to the /var/opt/ds_agent/slowpath directory

cd /var/opt/ds_agent/slowpath

Create the dsva-ovf.env file (if the file exists, delete the existing file first):

touch dsva-ovf.env

Reboot the appliance, once rebooted give it 5 minutes and the alarm should clear automatically:

reboot
Manage your PowerCLI vCenter menu entries

Start or stop ESXi services using PowerCLI

Start the ssh service on all hosts:

Get-VMHost | Foreach {
	Start-VMHostService -HostService ($_ | Get-VMHostService | Where {$_.Key -eq "TSM-SSH"})
}
PowerShell

If you want to start the ssh service on a single host, change ESXiHostName to your ESXi FQDN:

Get-VMHost -Name ESXiHostName | Foreach {
  Start-VMHostService -HostService ($_ | Get-VMHostService | Where {$_.Key -eq "TSM-SSH"})
}
PowerShell

If you want to stop the ssh service on all hosts:

Get-VMHost | Foreach {
  Stop-VMHostService -HostService ($_ | Get-VMHostService | Where {$_.Key -eq "TSM-SSH"})
}
PowerShell

If you have multiple cluster in vCenter, are connected to multiple vCenters, be sure to launch the command only to the necessary hosts:

  • Get-Cluster -Name ClusterName will filter to the specified Cluster
  • Get-VMHost -Name ESXiHostName will filter to the specified ESXi
  • Get-VMHost -Server vCenterServerName will filter to the specified vCenter server
Get-Cluster -Name ClusterName | Get-VMHost -Name ESXiHostName -Server vCenterServerName | Foreach {
  Stop-VMHostService -HostService ($_ | Get-VMHostService | Where { $_.Key -eq "TSM-SSH"} )
}
PowerShell

These are other services I frequently use:

  • DCUI (Direct Console UI)
  • lwsmd (Active Directory Service)
  • ntpd (NTP Daemon)
  • sfcbd-watchdog (CIM Server)
  • snmpd (SNMP Server)
  • TSM (ESXi Shell)
  • TSM-SSH (SSH)
  • vmsyslogd (Syslog Server)
  • vmware-fdm (vSphere High Availability Agent)
  • vpxa (VMware vCenter Agent)
  • xorg (X.Org Server)

There are other services available but I have never used them in this context (yet):

  • lbtd (Load-Based Teaming Daemon)
  • pcscd (PC/SC Smart Card Daemon)
  • vprobed (VProbe Daemon)

Change the startup policy for a service:

  • Automatic: Start automatically if any ports are open, and stop when all ports are closed
  • On: Start and stop with host
  • Off: Start and stop manually
Get-VMHost | Foreach {
	Set-VMHostService -HostService ($_ | Get-VMHostService | Where {$_.key -eq "TSM-SSH"}) -policy On
}
PowerShell
From IOmeter to VMware I/O Analyzer fling

From IOmeter to VMware I/O Analyzer fling

VMware I/O Analyzer is a tool to launch orchestrated tests against a storage solution available from the VMware flings website. It can be used as a single appliance where the worker process and the analytics is done within. Additional appliances can be deployed to act as Worker VMs. The Analyzer VM launches IOmeter tests (on the Worker VMs) and after test completion it collects the data. All configuration is done from a web interface on the Analyzer VM.

This post is describing how I deployed VMware I/O Analyzer and how I got to a test with maximized IOs. The first tests were conducted launching a IOmeter from within a virtual machine on the vSAN datastore and showed more or less 300 IOs being generated. In the end 18 Worker VMs with 8 disks each on a 6 host vSAN cluster were used generating 340K+ IOPS. The purpose was to create a baseline for a VSAN datastore maximum IOPs.

Hardware used

6 hosts
1 disk group
1 800GB SSD drive5 1,2 TB 10K SAS
vSphere 5.5 U3

General

The VM OS disks should not be put on the vSAN datastore you want to test, if not the generated IOPs will be part of your report. To keep the Analyser VM IOPS out of the performance graphs, put it on a different datastore.

Deploy one Analyser VM. Deploy a Worker VM per ESXi host. You should end up with as much Worker VMs as you have hosts in your cluster.

I changed the IP of all VMs to static as there was no DHCP server available in the subnet. This means that no DNS entries were required.

Preferably you will want to change the Analyser VM to a static IP as you will manage the solution from a web browser. The Worker VMs you can leave as is if there is DHCP server available. You will need dns entries and change the configuration used here.

To work easily set the Worker VMs on static IPs or create dns aliases as you will be doing a lot of work on the Worker VMs. I prefer static IPs because they add no complexity due to name resolving, etc…

Prerequisites

Download ova from: https://labs.vmware.com/flings/i-o-analyzer

Deploy

Deploying the Analyser VM:

Deploy ovf template. Choose your settings in regards to the recommendations above.

Delete the 100MB disk (second disk) from the virtual machine.

Start the Analyser VM via vSphere client and the open console

Login with root – vmware

A terminal window will be opened upon login

To configure static IP:

Change /etc/sysconfig/network/ifcfg-eth0 with your preferred text editor.

vi /etc/sysconfig/network/ifcfg-eth0
ShellSession

Assuming the subnet you’re deploying the vm is 192.168.1.0/24

Change the following lines highlighted to your needs:

BOOTPROTO=’static’
BROADCAST=’192.168.1.255’
ETHTOOL_OPTIONS=''
IPADDR=’192.168.1.20’
MTU=’1500’
NAME='82545EM Gigabit Ethernet Controller (Copper)'
NETMASK=’255.255.255.0’
NETWORK=’192.168.1.0’
REMOTE_IPADDR=''
STARTMODE='auto'
USERCONTROL='no'
ShellSession

Leave the other lines as is.

Save and close the file (:wq)

Now we will configure the default gateway

Assuming your default gateway is 192.168.1.1

vi /etc/sysconfig/network/routes
(The file will be created if it doesn’t exist)
ShellSession

Add / Change the following line:

Default 192.168.1.1 - -
(Default space GW space hyphen space hyphen)
ShellSession

Save and close the file (:wq)

Restart the network service:

service network restart
ShellSession

Check if the VM is reachable.

Now shutdown the VM.

Deploying the Worker VM:

Clone the Analyser VM.

Add a Hard Disk of 1GB.

Choose advanced and put the 1GB disk on the VSAN datastore.

I needed to configure static IPs on the Worker VMs, so I had to start each VM and change the IP address. After changing the network settings, shut down the VM and create a new clone. Not changing the IPs will give duplicate IPs.

Ease of access configuration

Two ease of access configurations were applied. The first is configured for easy copying from the Analyzer VM to the Worker VMs. The second because all appliances need to be logged onto for the VMware IO Analyzer solution to work. All commands are executed on the Analyzer VM and then copied to the Worker VMs.

Setup ssh keyless authentication

Generate a key pair

ssh-keygen (with an empty passphrase)
ShellSession

ssh-copy-id will copy your public key to the target machine

ssh-copy-id -i id_rsa.pub root@192.168.1.21
ssh-copy-id -i id_rsa.pub root@192.168.1.22
ssh-copy-id -i id_rsa.pub root@192.168.1.23
ssh-copy-id -i id_rsa.pub root@192.168.1.24
ssh-copy-id -i id_rsa.pub root@192.168.1.25
ssh-copy-id -i id_rsa.pub root@192.168.1.26
ShellSession

The root account password of the destination will need to be supplied for each of the above lines.

BE AWARE: This has the following security downside. If the root account is compromised on the Analyzer vm all worker vms should be considered compromised too.

Autologon

Change autologon=”” to autologon=”root” in the displaymanager (/etc/sysconfig/displaymanager) file with the following command:

sed -i ‘s/AUTOLOGIN=””/AUTOLOGIN=”root”/g’ /etc/sysconfig/displaymanager
ShellSession

This will force the machine to login with root after boot.

Copy the file to all workers:

scp /etc/sysconfig/displaymanager root@192.168.1.21:/etc/sysconfig/
scp /etc/sysconfig/displaymanager root@192.168.1.22:/etc/sysconfig/
scp /etc/sysconfig/displaymanager root@192.168.1.23:/etc/sysconfig/
scp /etc/sysconfig/displaymanager root@192.168.1.24:/etc/sysconfig/
scp /etc/sysconfig/displaymanager root@192.168.1.25:/etc/sysconfig/
scp /etc/sysconfig/displaymanager root@192.168.1.26:/etc/sysconfig/
ShellSession

Affinity rules

TIP: Create affinity rules in vCenter to keep the Worker VMs on dedicated hosts, otherwise the configuration on the VMware I/O Analyzer dashboard will be outdated soon. The consequence is that certain Worker VMs will not be launching their IOmeter profiles and therefor the reports will not be correct.

Configuration

Prerequisites

Enable the SSH service on the ESXi hosts via the vSphere (Web) Client or through Powershell.

The powershell way: (be aware to filter your hosts if needed). There is a dedicated post about starting and stopping ESXi services through powershell here.

Get-VMHost | Foreach {
   Start-VMHostService -HostService ($_ | Get-VMHostService | Where { $_.Key -eq "TSM-SSH"} )
}
ShellSession

Dashboard

Add the hosts to the host list.

Search for the Worker VMs in the list and add preferred IO test.

There are a lot of standard tests included in the appliance. The one that should be generating the most IOPs is 4k, 100% read and 0% random.

Optimized setup

To reach an optimized setup, three Worker VMs per host were deployed and 7 additional disks were added.

Adding the extra disks via PowerCLI:

$VMs = Get-VM -Name "*IOW*"

ForEach ($vm in $VMs) {ForEach ($num in 1..7) { New-HardDisk -CapacityGB 1 -datastore vsan* -VM $vm.name}}
ShellSession

The following specification was created on the Analyzer VM…

'TEST SETUP ====================================================================
'Test Description
	4k_100Read_0Rand_cust
'Run Time
' hours minutes seconds
	0 1 0
'Ramp Up Time (s)
	0
'Default Disk Workers to Spawn
	NUMBER_OF_CPUS
'Default Network Workers to Spawn
	0
'Record Results
	ALL
'Worker Cycling
' start step step type
	1 1 LINEAR
'Disk Cycling
' start step step type
	1 1 LINEAR
'Queue Depth Cycling
' start end step step type
	1 32 2 EXPONENTIAL
'Test Type
	NORMAL
'END test setup
'ACCESS SPECIFICATIONS =========================================================
'Access specification name,default assignment
	4k; 100% Read; 0% Random, NONE
'size,% of size,% reads,% random,delay,burst,align,reply
	4096,100,100,0,0,1,4096,0
'END access specifications
'MANAGER LIST ==================================================================
'Manager ID, manager name
	1,IOA-manager
'Manager network address
	127.0.0.1
'Worker
	IOA-worker
'Worker type
	DISK
'Default target settings for worker
'Number of outstanding IOs,test connection rate,transactions per connection
	16,DISABLED,1
'Disk maximum size,starting sector
	0,0
'End default target settings for worker
'Assigned access specs
	4k; 100% Read; 0% Random
'End assigned access specs
'Target assignments
'Target
	sdb
'Target type
	DISK
'End target
'End target assignments
'End worker
'Worker
	IOA-worker
'Worker type
	DISK
'Default target settings for worker
'Number of outstanding IOs,test connection rate,transactions per connection
	16,DISABLED,1
'Disk maximum size,starting sector
	0,0
'End default target settings for worker
'Assigned access specs
	4k; 100% Read; 0% Random
'End assigned access specs
'Target assignments
'Target
	sdc
'Target type
	DISK
'End target
'End target assignments
'End worker
'Worker
	IOA-worker
'Worker type
	DISK
'Default target settings for worker
'Number of outstanding IOs,test connection rate,transactions per connection
	16,DISABLED,1
'Disk maximum size,starting sector
	0,0
'End default target settings for worker
'Assigned access specs
	4k; 100% Read; 0% Random
'End assigned access specs
'Target assignments
'Target
	sdd
'Target type
	DISK
'End target
'End target assignments
'End worker
'Worker
	IOA-worker
'Worker type
	DISK
'Default target settings for worker
'Number of outstanding IOs,test connection rate,transactions per connection
	16,DISABLED,1
'Disk maximum size,starting sector
	0,0
'End default target settings for worker
'Assigned access specs
	4k; 100% Read; 0% Random
'End assigned access specs
'Target assignments
'Target
	sde
'Target type
	DISK
'End target
'End target assignments
'End worker
'Worker
IOA-worker
'Worker type
	DISK
'Default target settings for worker
'Number of outstanding IOs,test connection rate,transactions per connection
	16,DISABLED,1
'Disk maximum size,starting sector
	0,0
'End default target settings for worker
'Assigned access specs
	4k; 100% Read; 0% Random
'End assigned access specs
'Target assignments
'Target
	sdf
'Target type
	DISK
'End target
'End target assignments
'End worker
'Worker
	IOA-worker
'Worker type
	DISK
'Default target settings for worker
'Number of outstanding IOs,test connection rate,transactions per connection
	16,DISABLED,1
'Disk maximum size,starting sector
	0,0
'End default target settings for worker
'Assigned access specs
	4k; 100% Read; 0% Random
'End assigned access specs
'Target assignments
'Target
	sdg
'Target type
	DISK
'End target
'End target assignments
'End worker
'Worker
	IOA-worker
'Worker type
	DISK
'Default target settings for worker
'Number of outstanding IOs,test connection rate,transactions per connection
	16,DISABLED,1
'Disk maximum size,starting sector
	0,0
'End default target settings for worker
'Assigned access specs
	4k; 100% Read; 0% Random
'End assigned access specs
'Target assignments
'Target
	sdh
'Target type
	DISK
'End target
'End target assignments
'End worker
'Worker
	IOA-worker
'Worker type
	DISK
'Default target settings for worker
'Number of outstanding IOs,test connection rate,transactions per connection
	16,DISABLED,1
'Disk maximum size,starting sector
	0,0
'End default target settings for worker
'Assigned access specs
	4k; 100% Read; 0% Random
'End assigned access specs
'Target assignments
'Target
	sdi
'Target type
	DISK
'End target
'End target assignments
'End worker
'End manager
'END manager list
ShellSession

… and copied over to the Worker VMs

scp ./VSAN_4k_100read_0rand.icf root@192.168.1.21:/var/www/configs/
scp ./VSAN_4k_100read_0rand.icf root@192.168.1.22:/var/www/configs/
scp ./VSAN_4k_100read_0rand.icf root@192.168.1.23:/var/www/configs/
scp ./VSAN_4k_100read_0rand.icf root@192.168.1.24:/var/www/configs/
scp ./VSAN_4k_100read_0rand.icf root@192.168.1.25:/var/www/configs/
scp ./VSAN_4k_100read_0rand.icf root@192.168.1.26:/var/www/configs/
ShellSession

Troubleshooting

I found that looking at the console of the Worker VMs is interesting for troubleshooting. You can see the IOmeter tests being launched. This was very usefull in the process of creating the IOmeter profile. You don’t need to wait untill the test is finished to see it has failed. Stopping IOmeter tests from the console gives the opportunity to look at, edit and save the launched profile.