Today I was playing around with vSphere with Tanzu. I want to consume vSphere with Tanzu and therefore I try to deploy an app from the bitnami repository. This should be pretty easy to do. Well I’m still in the learning phase so bear with me if this is something obvious …
These are the steps I’m doing
Install helm
Add bitnami repo
Install app from the bitnami repo
Deploy an app from the bitnami repo on a Tanzu Kubernetes Grid (TKG) cluster (deployed on vSphere with Tanzu)
So I tried to deploy redis to the TKG cluster. It needs a Persistent Volume (PV) so at deploy time a Persistent Volume Claim (PVC) would be issued and a PV should be assigned. When I saw it took a while to get my redis app deployed I looked at the namespace – Monitor – Events – Kubernetes and saw that there was an error: ‘no persistent volumes available for this claim and no storage class is set’.
In my case the issue was that I did not specify the defaultClass when I created the TKG cluster. I used the following yaml file to create the TKG cluster. The highlighted lines were not in the yaml file when I created the TKG cluster and these specify what storage class should be used by default.
So I executed (the k8s-01.yaml file has the above content)
kubectl apply -f k8s-01.yaml
ShellSession
and received the following error:
TanzuKubernetesCluster error
As I was still in the TKG cluster context I could not change the TKG cluster spec. So I need to change the context to the namespace ‘demo’ (where I deployed my TKG cluster)
kubectl config use-context demo
ShellSession
I reapplied the yaml file, changed the context again to the TKG cluster and issued the command:
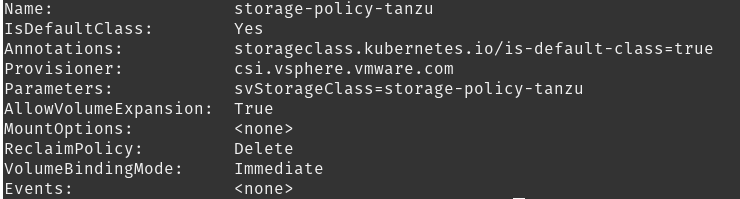
kubectl describe storageclass
ShellSession
Now we see that there is a default storage class for this cluster:
Cluster default storage class changed
And when I launch the deploy again:
kubectl run redis bitnami/redis
ShellSession
I see that the deploy is succeeding. Woohoo
UPDATE: @anthonyspiteri has come to the same conclusion in later blog posts
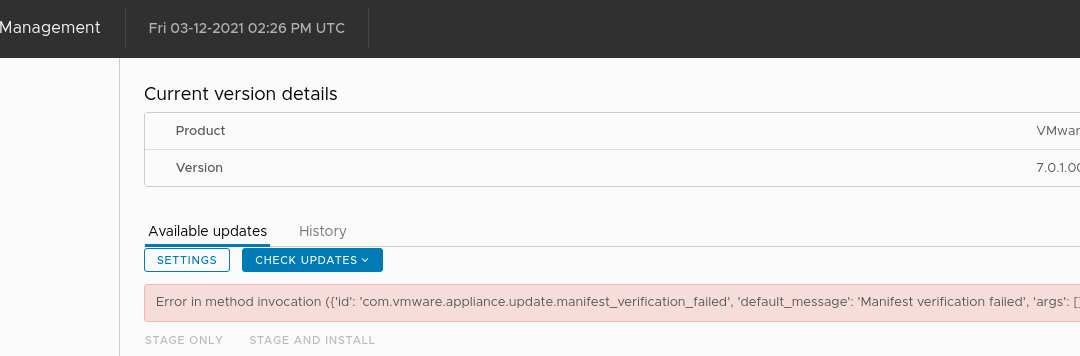
Today I deployed a new VCSA 7 U1 and as U2 has GA’d recently I wanted to update the environment first. So I headed to the VAMI interface > Available Updates page. Immediately there was an error:
I found some blogs that showed to delete upgrade status file ‘software_update_state.conf’ at /etc/applmgmt/appliance. While I tested with renaming this file to .old this did not resolve the error.
The file was recreated but held the same info, which is in JSON format and has an the following content:
{ "state": "UP_TO_DATE"}
ShellSession
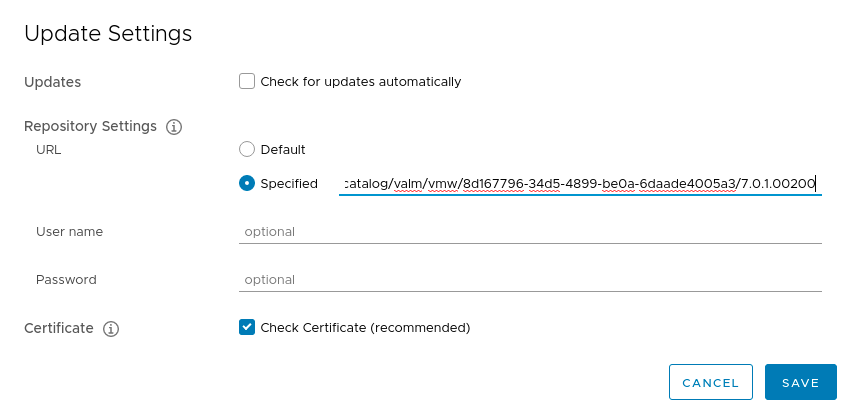
“UP_TO_DATE”, it clearly is not. So I found this KB article. This is also where I got the solution for my install. I compared the url I found in the KB article with the one that is included by default in the update settings page.
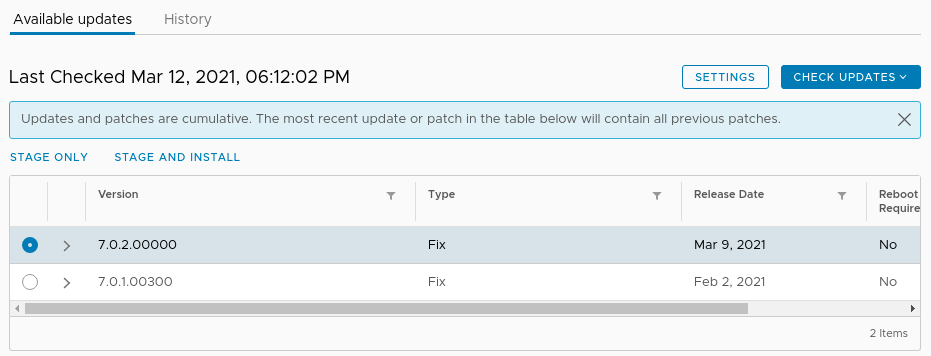
In my case when I alleviated the .latest from that url, updates are detected and I can proceed.
So as you can see in the screenshot below (well not entirely but you will need to take my word for it), I selected ‘Specified’ and supplied the following url:
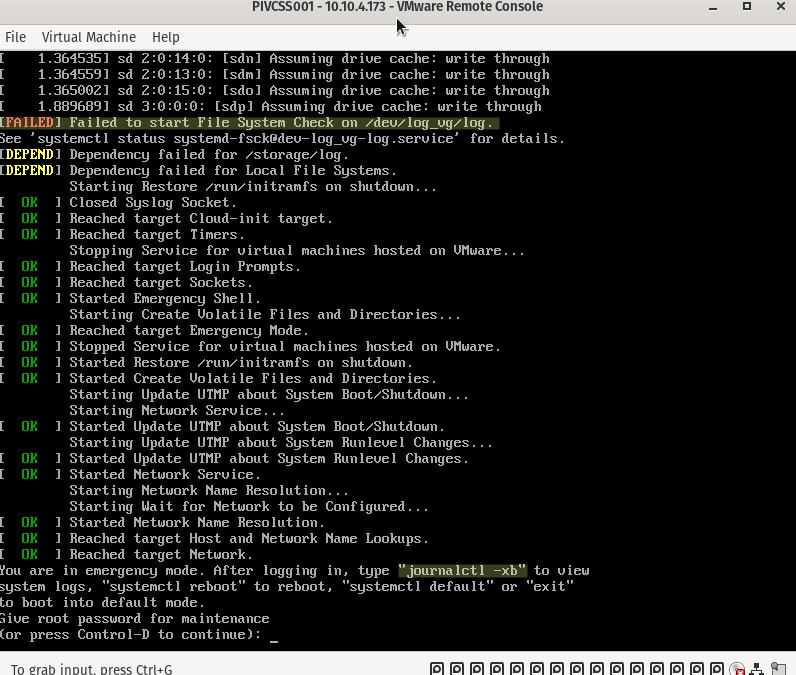
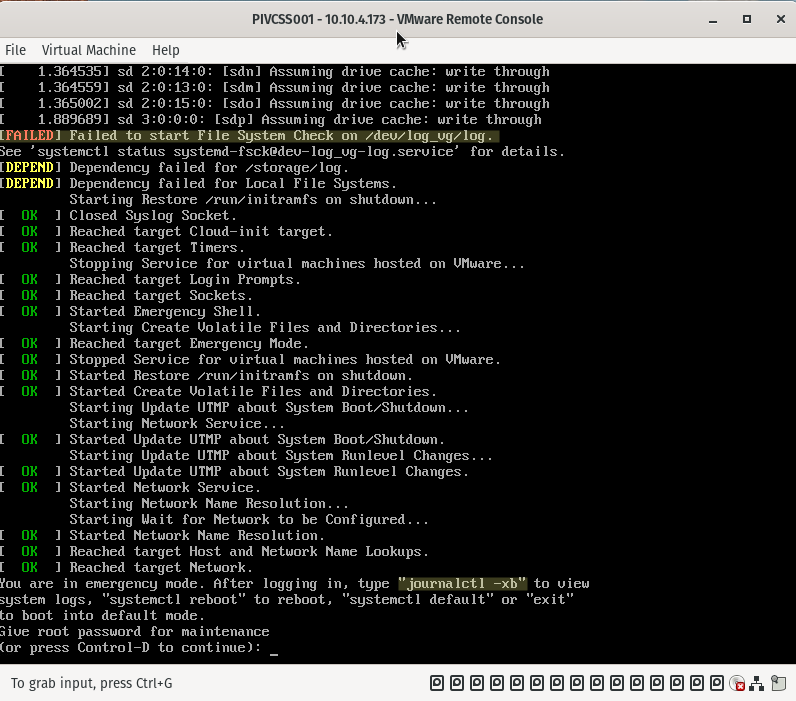
Due to a power failure of the storage where the vCenter Server Appliance resides, the VCSA does not boot. Connecting to the console shows the following output:
vCenter console File System Check error
When you see this screen, none of the services are started as the appliance does not fully start. This implies that there is no means of connecting to the H5 client nor the VAMI interface on port 5480.
Why does the VCSA not boot and where do I start troubleshooting?
There are two important things to mentioned on the screenshot above, this is where we start:
Failed to start File System Check on /dev/log_vg/log
journalctl -xb
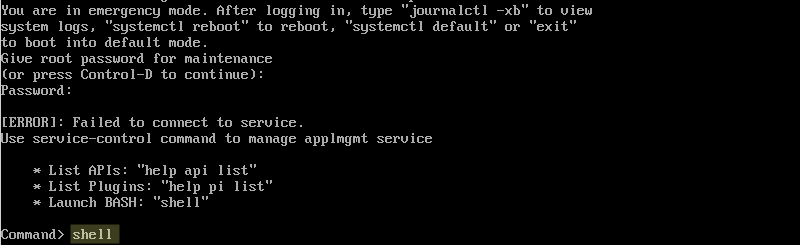
First we take a look at ‘journalctl -xb’. To do this we need to supply the root password and launch the BASH:
Emergency mode bash shell
journalctl -xb
Now that have shell access we can take a look at ‘journalctl -xb’:
journalctl -xb
ShellSession
Type G to go to the bottom of the log file:
G
ShellSession
Work upwards, the most relevant logs will be at the bottom. For the sake of this blog post, I have type -S. This will turn on/off word wrap, in this case, I turned on word wrap.
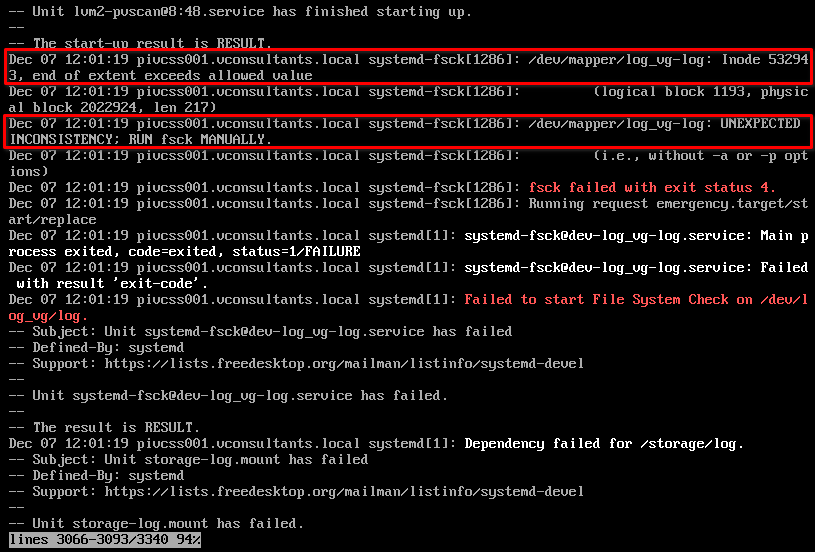
Going up a little I find these entries:
There is a problem with a certain inode and File System Check (fsck) should be run manually.
journalctl -xb
File System Check
Let’s see how we can do that. Is it as simple as running:
fsck /dev/mapper/log_vg-log
ShellSession
It seems like it. Running the above command finds some errors and suggests to repair. I confirmed.
Other volumes
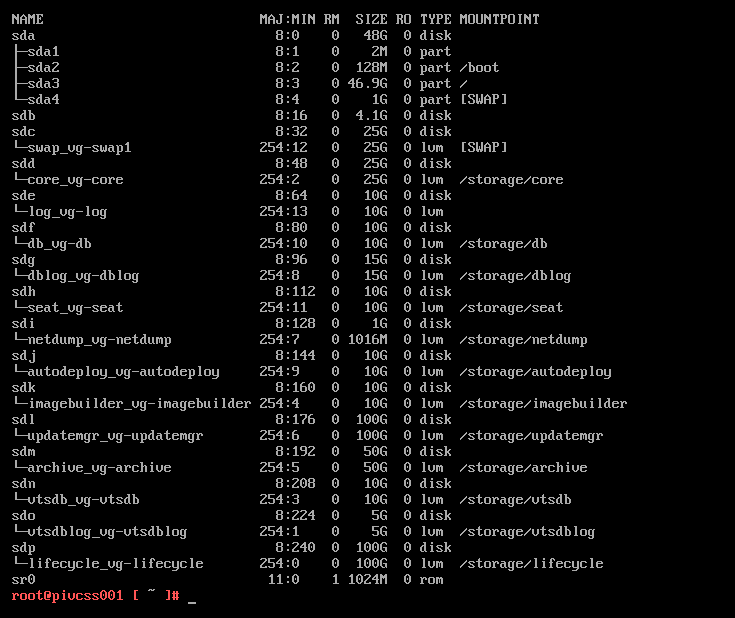
Let’s check the other logical volumes (lvm). First we will run ‘lsblk’ to take a look at the drive layout:
lsblk
ShellSession
VCSA drive layout
Remark: When we take a look at the type, we see the disks, eg. sda, sdb, etc… The difference between sda and the rest is that sda is partitioned with standard partitions and on the rest the disks an LVM has been created.
I checked all other volumes and found none of them were having issues.
Reboot
To reboot while you are in maintenance boot:
reboot --force
ShellSession
After the reboot, I could connect to the H5 client and clear the relevant errors.
Remark
This blog post is very similar to this one here. Although they are very much alike, the issues in the older blog post were on a standard partition on a VCSA 6.5 whereas the issues described and addressed in this post are on a VCSA 7.0 LVM physical volume.
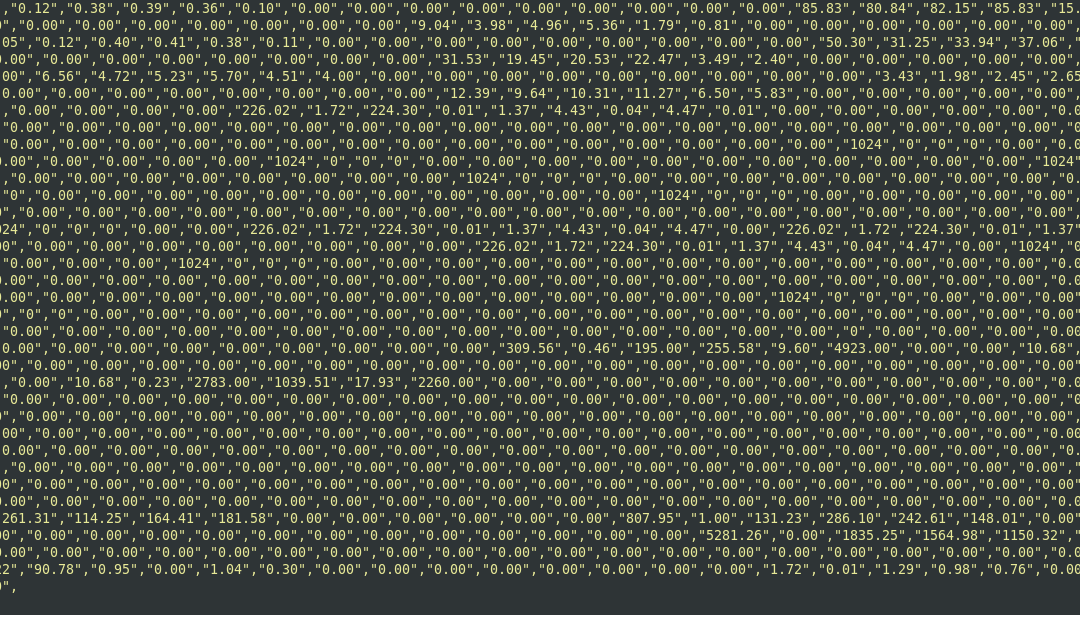
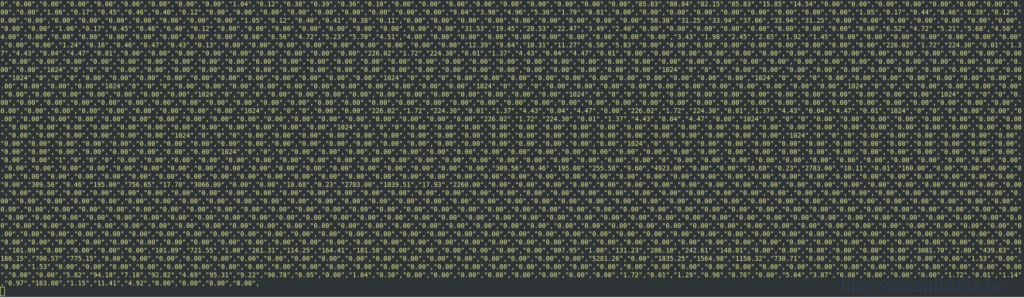
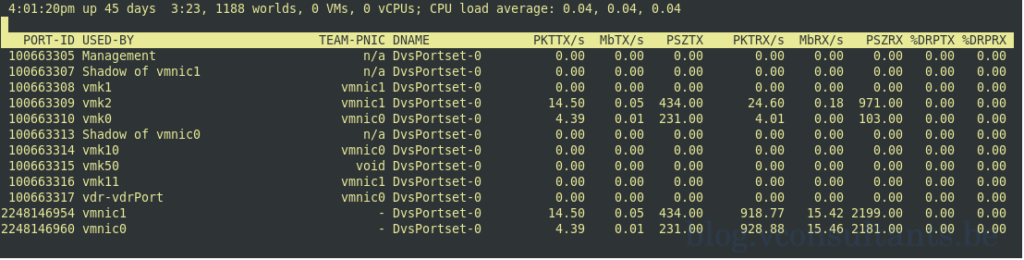
When you connect to your ESXi host and you launch esxtop. You look at the esxtop output and it is not displaying as it should. Instead, it is displaying like in the below screenshot:
Scrambled esxtop output
Your esxtop output will be displayed correctly if you are using a terminal emulator that defaults to xterm as the TERM environment variable. Some terminal emulators will use another terminal emulator value by default, eg. xterm-256color. ESXi does not map xterm-256color to one of the values it knows, so it doesn’t know how to display the output.
There is a KB article that explains how to resolve:
Output of esxtop defaults to non-interactive CSV with unknown TermInfo (2001448)
The value of the environment variable TERM is used by the server to control how input is recognized by the system, and what capabilities exist for output.
Let us have a look first what the TERM variable is in my case:
echo $TERM
ShellSession
I am receiving the following output:
Display term variable content
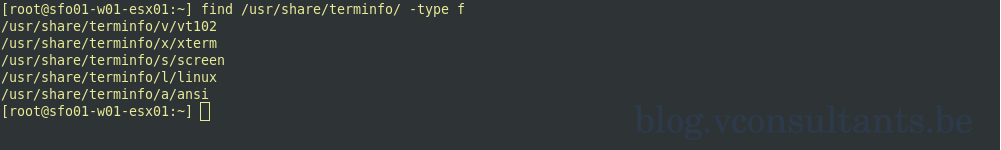
My terminal emulator tries to connect to the endpoint (ESXi) with xterm-256color. Now let’s take a look at what values this endpoint does support:
Show supported terminal encoding on ESXi
So all of the above is possible to assign to TERM. The value my terminal emulator uses is not among the supported terminfo types. So the ESXi host cannot map to any of the known and thus does not know how to display the esxtop info correctly.
When we update the TERM environment variable to xterm and try to run esxtop again, the output will show nicely formatted.
TERM=xtermecho $TERM
ShellSession
Let’s check esxtop again to make sure the outcome is as expected:
So I changed the admin password ‘password-expiration’, not even bothering to open the event details. I just assumed this is about the admin user.
clear user admin password-expiration
ShellSession
Done.
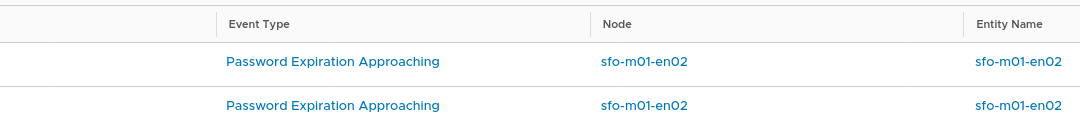
Not true. Some time later that day I found that the alarms were still open. I figured that this is some sort of timing issue, that the alarms were not automatically cleared yet. So I set them to resolved manually. Almost the same minute the alarms are triggered again, so no timing issue. If I only would have counted the alarms the first time it would have showed me that there more alarms than NSX-T components where I cleared the password expiration for the admin user.
audit user password expired
It was only when I read the alarm in detail that I noticed the alarm is not the same one I saw before. This alarm was not triggered about the password expiration of the admin user but showed that it was for the audit user. The alarms are very much the same only the username is different, so easily overlooked.
So doing the math. Initially I had 8 open alarms, of which 3 were put to resolved automatically after changing the password expiration of the admin user. One on the NSX-T Manager and one on each of the 2 edge nodes. Which left 5 open alarms to take care of. Checking all the alarms gave me the following actions:
clear alarm for the root user on NSX-T Manager
clear alarms for the root user and the audit user on the NSX-T Edge 1 and 2
CAUTION
Password expiration should be part of your password policy strategy. Disabling the password expiration on a production system is not a good strategy.